QR · #cmpwvg
LGS · 8. Sınıf›İngilizce›In the Kitchen
📋 AI-Komite⭐ Vitrin🎯 T.8.3.2🧠 Bloom 2
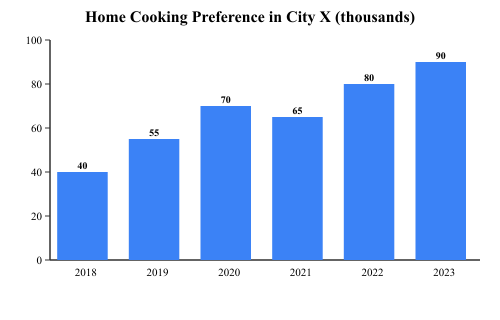
According to the graph, which year had the highest number of people who prefer cooking at home?
The graph shows the number of people (in thousands) who prefer cooking at home in City X from 2018 to 2023. 2018: 40, 2019: 55, 2020: 70, 2021: 65, 2022: 80, 2023: 90.
A)2022
B)2020
C)2023
D)2021
Bu konuda daha çok soru çöz
ÖğreTio'da 7 branş öğretmeni, kişiselleştirilmiş kazanım takibi ve yapay zekâ destekli çözüm anlatımı seni bekliyor.
© 2026 ÖğreTio · ogretio.ai