QR · #cmpwvg
LGS · 8. Sınıf›İngilizce›Weather and Emotions
📋 AI-Komite⭐ Vitrin🎯 İNG.8.5.1🧠 Bloom 3
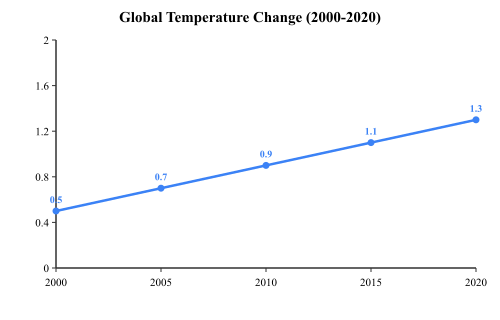
Aşağıdaki grafik 2000-2020 yılları arasında küresel sıcaklık değişimini göstermektedir.
What can be concluded from the graph?
A)The temperature decreased between 2000 and 2020.
B)The temperature increased by 0.8 degrees from 2000 to 2020.
C)The temperature was highest in 2005.
D)The temperature stayed the same for 20 years.
Bu konuda daha çok soru çöz
ÖğreTio'da 7 branş öğretmeni, kişiselleştirilmiş kazanım takibi ve yapay zekâ destekli çözüm anlatımı seni bekliyor.
© 2026 ÖğreTio · ogretio.ai