QR · #cmpwvf
LGS · 8. Sınıf›İngilizce›Science
📋 AI-Komite⭐ Vitrin🎯 İNG.8.1.4🧠 Bloom 2
The graph shows the amount of water used in a science experiment over five days.
Which of the following is correct according to the graph?
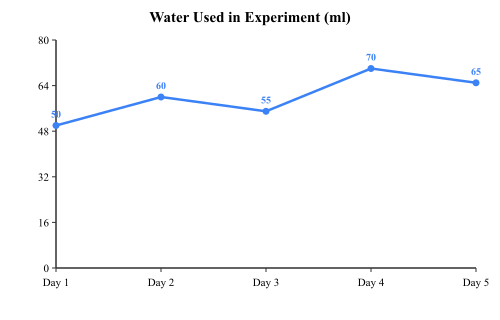
A)The amount of water increased every day.
B)The most water was used on Day 4.
C)Day 2 used less water than Day 3.
D)The amount of water stayed the same.
Bu konuda daha çok soru çöz
ÖğreTio'da 7 branş öğretmeni, kişiselleştirilmiş kazanım takibi ve yapay zekâ destekli çözüm anlatımı seni bekliyor.
© 2026 ÖğreTio · ogretio.ai